OpenTelemetry
OpenTelemetry is a collection of tools, APIs, and SDKs that helps you instrument, generate, collect, and export telemetry data (metrics, logs, and traces). This data helps you analyze your software's performance and behavior.nTelemetry
OpenTelemetry is a collection of tools, APIs, and SDKs. Use it to instrument, generate, collect, and export telemetry data (metrics, logs, and traces) to help you analyze your software’s performance and behavior.
Integration
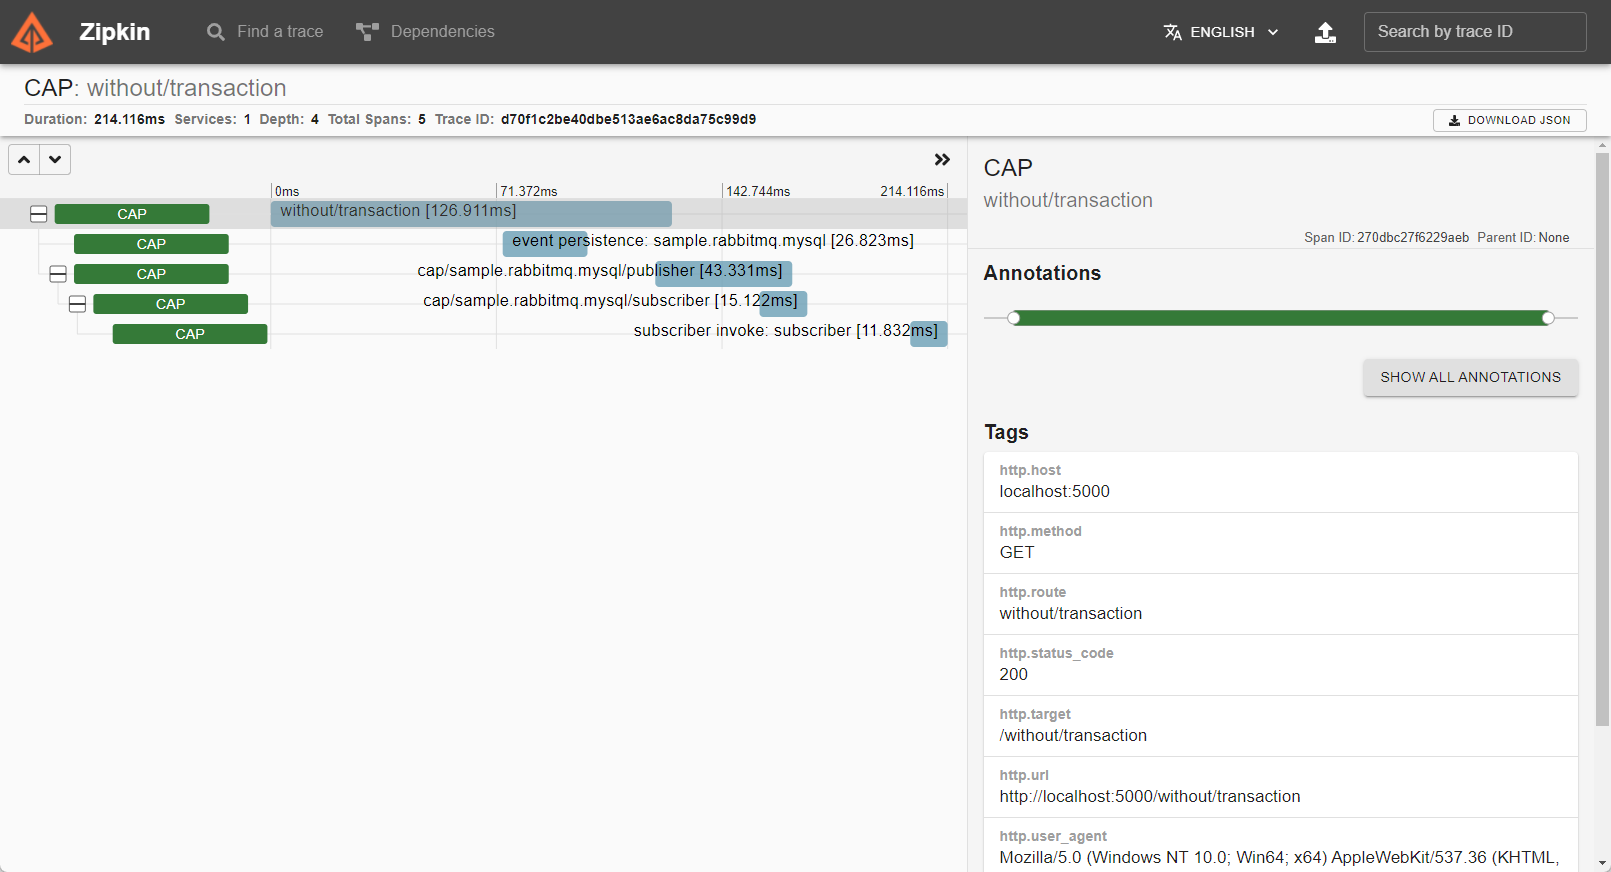
You can find information about using OpenTelemetry in console applications or ASP.NET Core here. Here we mainly describe how to trace CAP data to OpenTelemetry.
Configuration
Install the CAP OpenTelemetry package into your project:
dotnet add package DotNetCore.CAP.OpenTelemetry
OpenTelemetry data comes from Diagnostics. Add the CAP instrumentation to your OpenTelemetry configuration:
services.AddOpenTelemetryTracing((builder) => builder
    .AddAspNetCoreInstrumentation()
    .AddCapInstrumentation()    // <-- Add this line
    .AddZipkinExporter()
);
If you don't use a framework that handles this automatically (like ASP.NET Core), make sure you enable a listener. For example:
ActivitySource.AddActivityListener(new ActivityListener()
{
    ShouldListenTo = _ => true,
    Sample = (ref ActivityCreationOptions<ActivityContext> _) => ActivitySamplingResult.AllData,
    ActivityStarted = activity => Console.WriteLine($"{activity.ParentId}:{activity.Id} - Start"),
    ActivityStopped = activity => Console.WriteLine($"{activity.ParentId}:{activity.Id} - Stop")
});

Context Propagation
CAP supports Context Propagation by injecting traceparent and baggage headers when sending messages and restoring the context from those headers when receiving messages.
CAP uses the configured Propagators.DefaultTextMapPropagator propagator, which is usually set to both TraceContextPropagator and BaggagePropagator by the dotnet OpenTelemetry SDK, but can be configured in your client program. For example, to opt out of Baggage propagation, you can call:
OpenTelemetry.Sdk.SetDefaultTextMapPropagator(
    new TraceContextPropagator());
For more details, see the dotnet OpenTelemetry.Api README.